I worked at this Danish company as a UI/UX Designer but I also participated in a lot of traditional graphic design tasks. This was a price comparison website which helped the customers to compare the prices of products between several grocery stores and to collect cheaper baskets for them. The company tried to reach more users/customers who will use its solution. Most of the design task were to help this goal through different communication channels.
Table of Contents
Used tools and methods
Project management
Adobe Photoshop
Adobe Illustrator
Adobe InDesign
Adobe XD
Adobe Animate
Adobe After Effects
Adobe Audition
Canva
Prototyping
Desktop research
Color theory
UX research
UI and webdesign
Branding
Refining the color usage
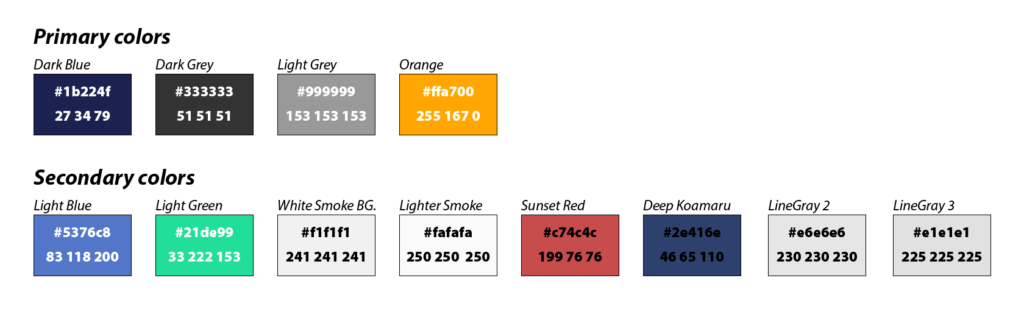
Before we started to designing and redesigning the different interfaces or any element of these we needed to establish a new, simplified and unique color scheme. When I started my journey at this company the usage of the colors were poorly defined. Because of the different color of products the website was overwhelmingly colorful we had to simplify that. In the end, we created a simple color scheme which was shared all over the company’s employees through Adobe CC Library.
A simplified color scheme to the further design development.
The primary colors were mainly used all over the whole website.
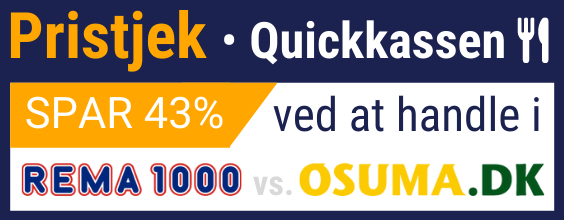
Secondary colors were under usage for create more accent on some important elements such as offers, special options, in presetations and visualisations or if we needed bigger contrast somewhere in the design.
As a UX/UI designer, my job was to analyze the actual interface and its effectiveness or look after the possible flaws. In a case of any digital product we can and need to analyze or conduct a proper research for the further development. Obviously this is also can give useful input and help to create more effective digital design and user interface. Because in this particular job I was also the company digital and graphic designer and I had to work together with the back-end developers it was also a natural part of my tasks.
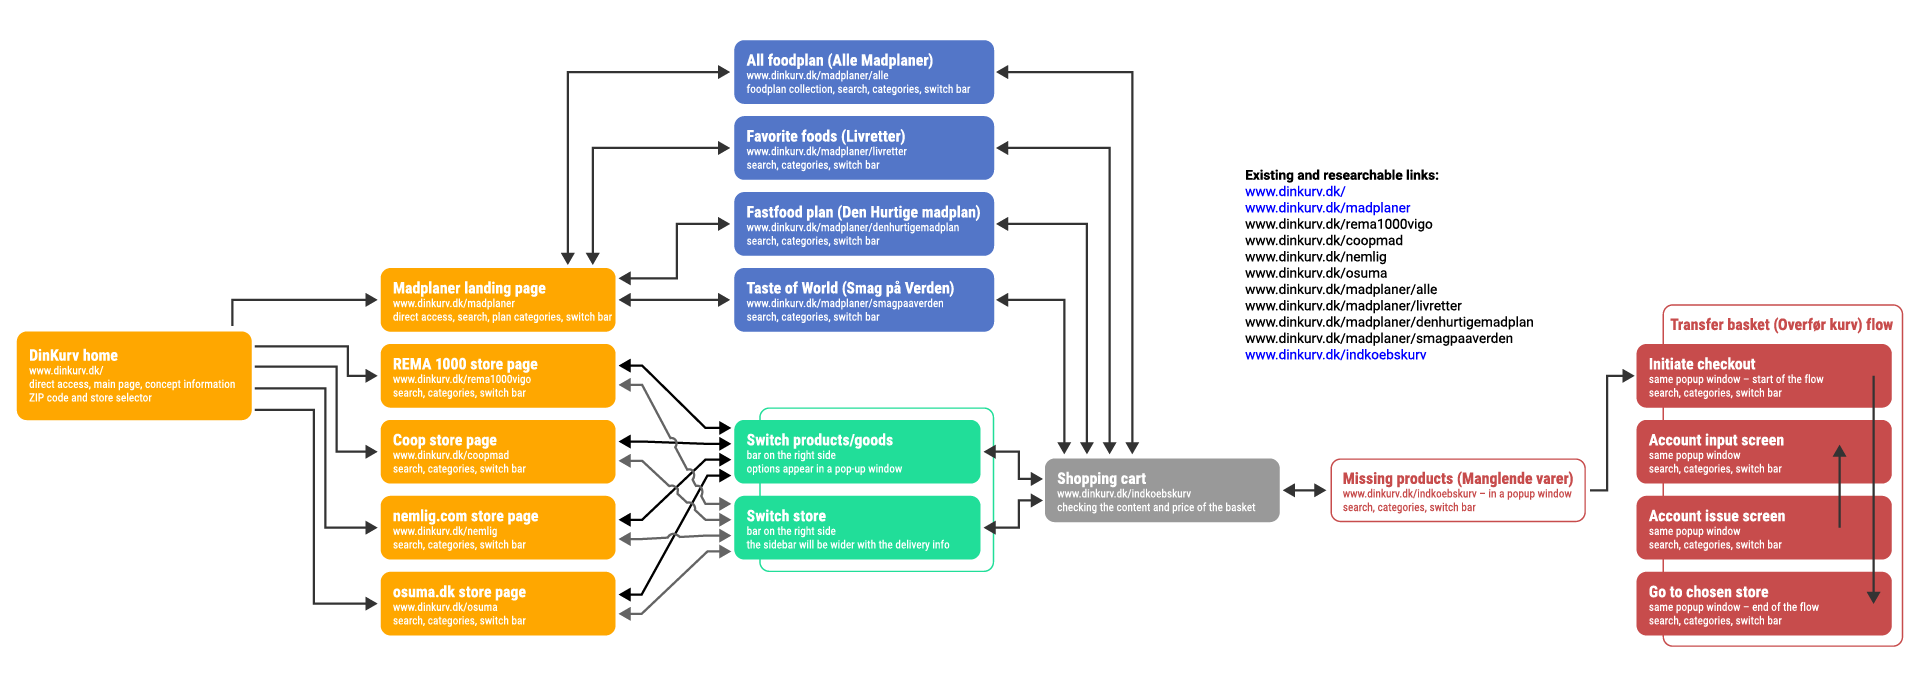
In a case of any digital product we can and need to analyze or conduct a proper research for the further development. With the visualization of the findings we can create a common ground and understanding inside the development team.
With the visualization of the findings we can create a common ground and understanding inside the development team. That is why I created these illustrations (diagrams) to help to understand the findings of the research. These helped to step towards a better design.
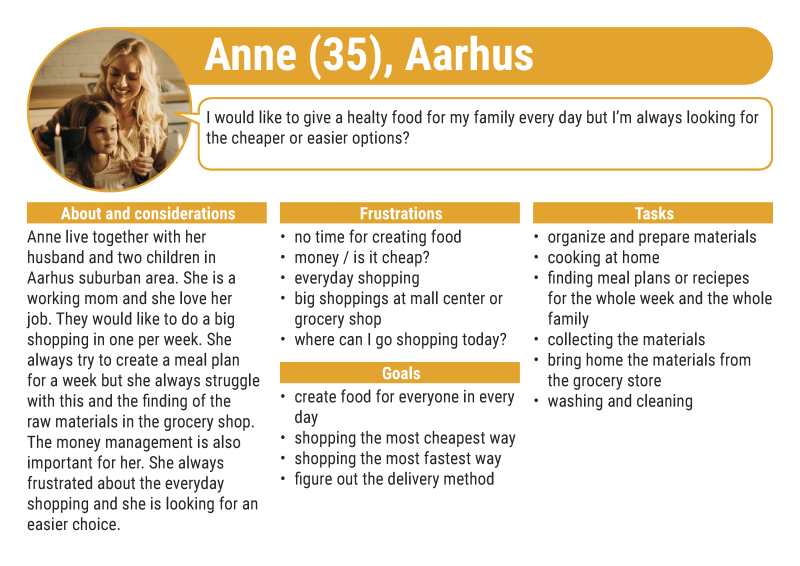
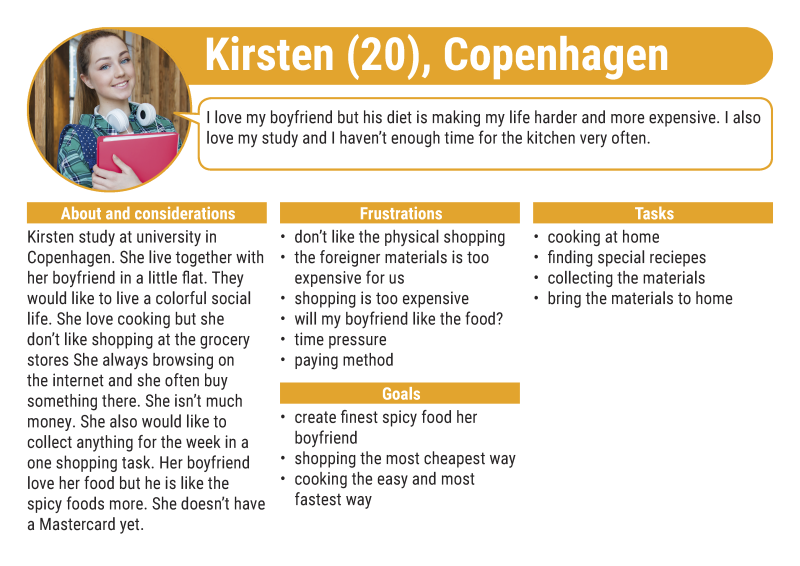
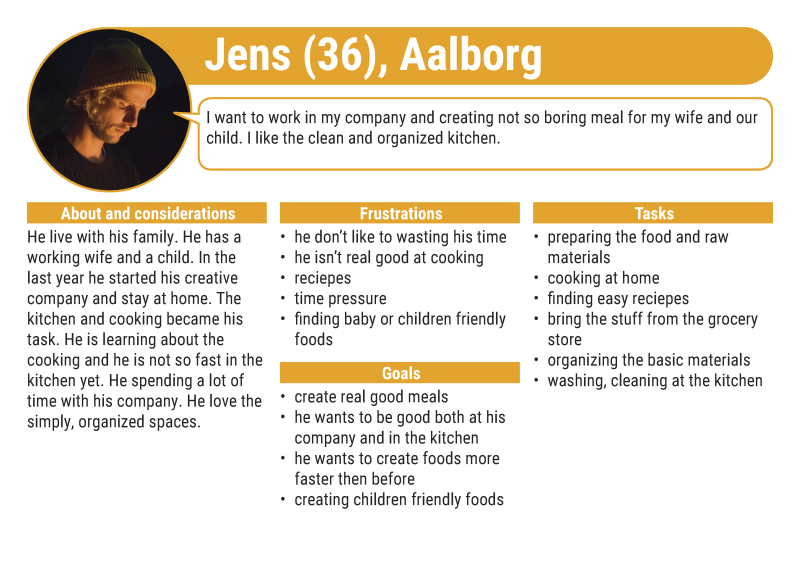
After I got some data from the company about the users and I also made my research on this topic I designed three persona to visualize the main customer groups of DinKurv.dk. This method also helped communicate about the user/customer needs with the developers.
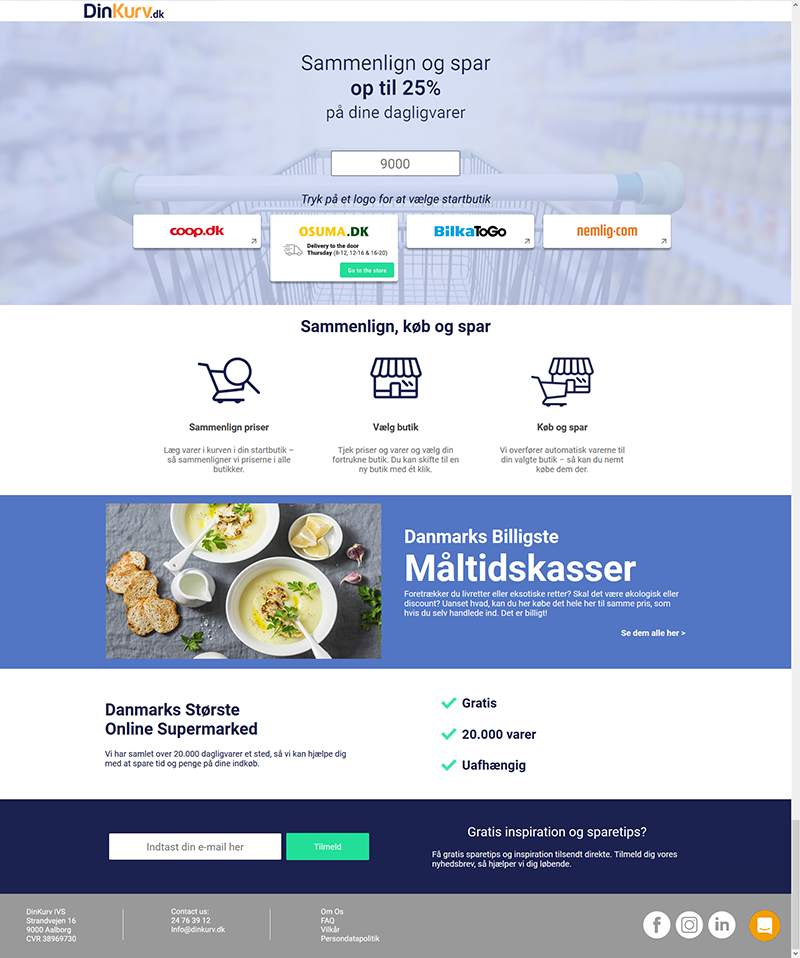
The first part what I had to redesign was the DinKurv.dk website landing page. Before that the page wasn’t contain this amount of information and used more colors which distracted the customers. The first goal was to eliminate the distraction, making different sections vertically for the content with a usage of the new color schemes.
The first goal was to eliminate the distraction...
This was a result of the landing page overhaul. This is an actual screen in an internet browser.
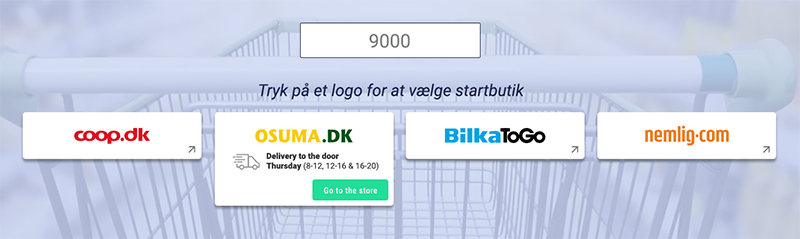
The different sections were presenting the different content with this harmonic color design. The main part and goal of the page was the store selecting option. See the next picture for more details.
The next row was contain basic information about the purpose of the website.
On the next row was a clickable service inside the website where the user can choose different meal boxes based on recipes. This was a shortcut for the users to make a meal plan and do the whole online shopping process faster.
Under that was another information row.
The next row was a CTA block where the users could subscribed to our newsletter.
At the last row was the footer of the whole website. This was the first time when the website got a proper footer which was the same all over the website and contained the basic and necessary information about the website and company. I also implement the SoMe links and an online chatbot button on the right side of the bar.
Click to the pictures for the bigger size.
This was the store selector part of the page. On the input field the customers could gave their postal codes. If some store didn’t deliver to that city or town then the button was turned gray and flat. The button design also helped to see those were actual and clickable buttons. After the first click the button also could showed the information about the delivery option with the actual grocery store which is helped to decide what store the customer wanted to use.
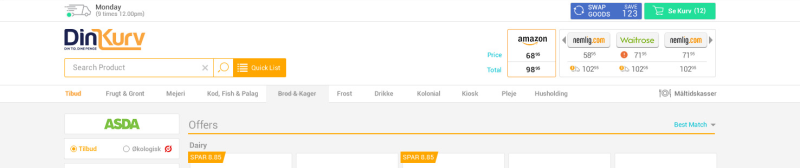
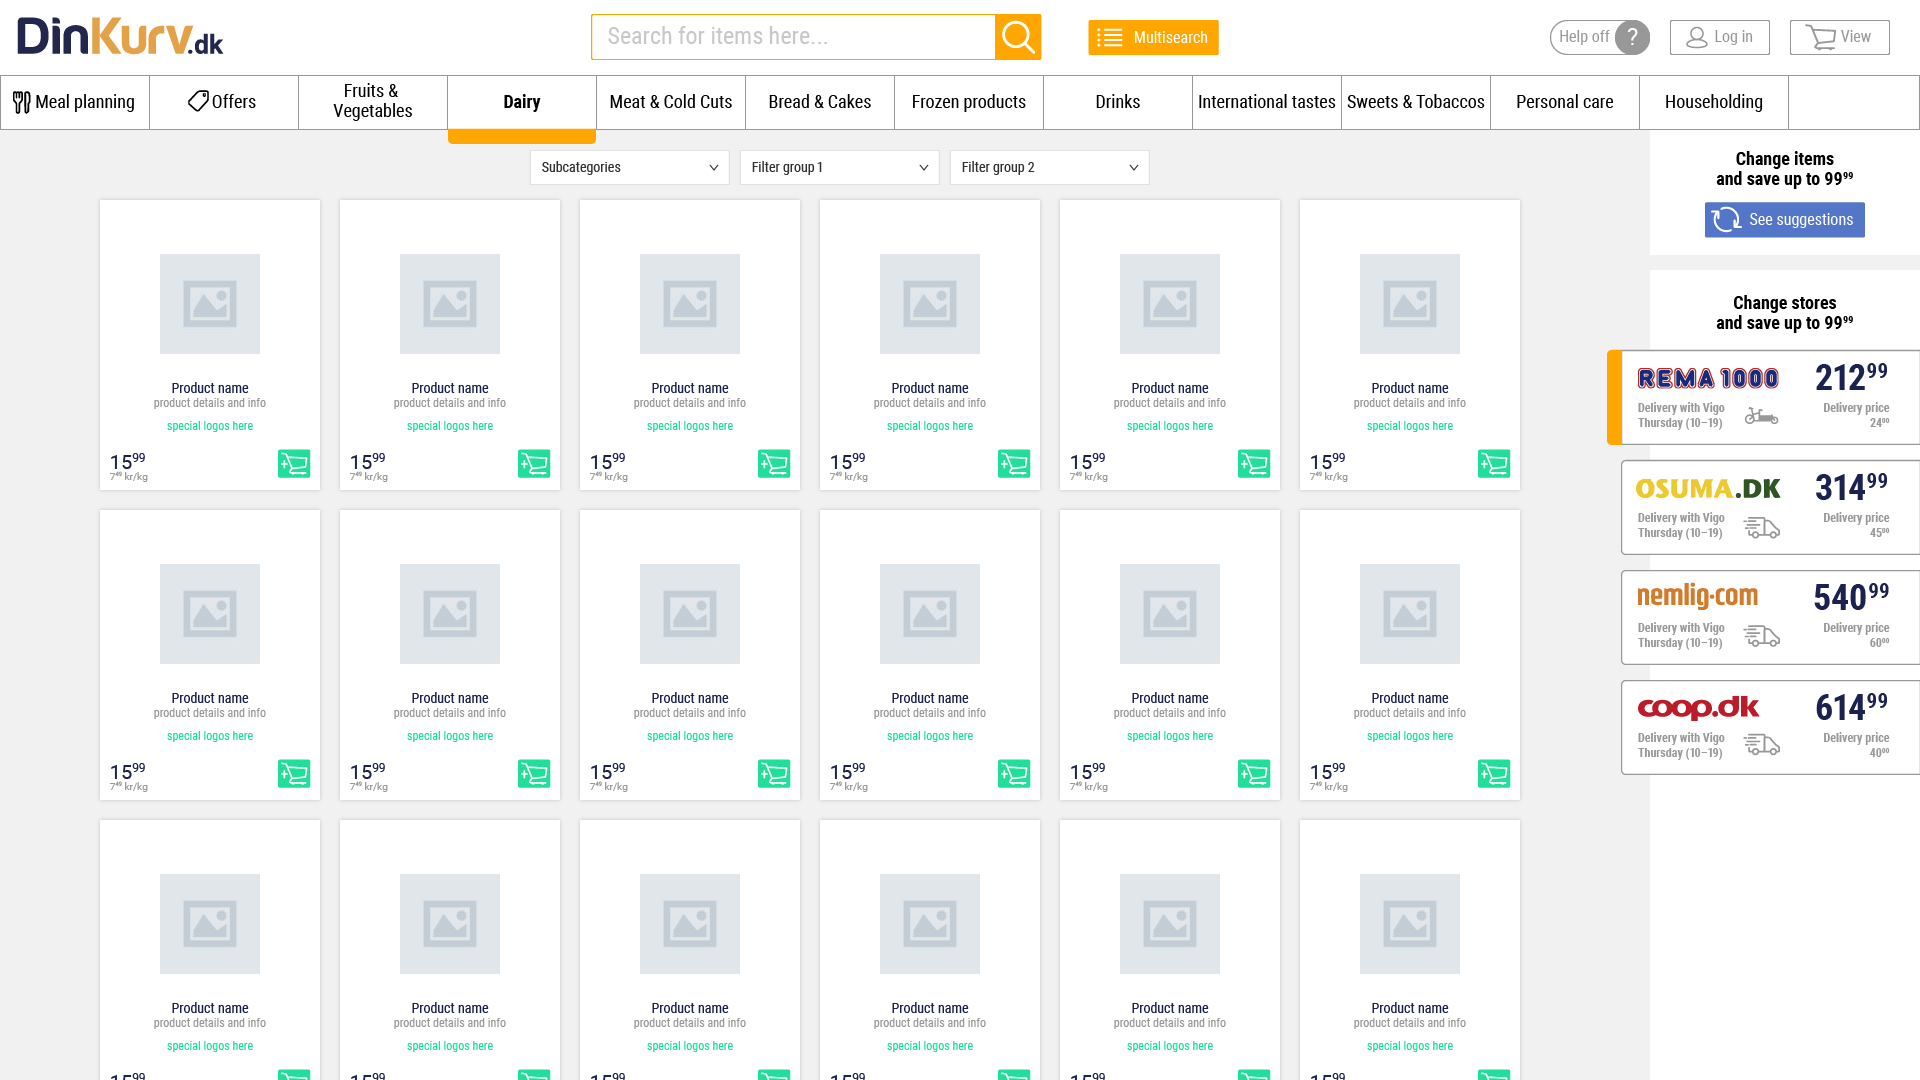
One of the biggest design-related tasks was working on the main product page. This page contained many options and information about products, categories, options, and filters. I had to create a harmonic interface where the user can understand everything, find the help functions and easily use the price comparison option of the website. I had to create the interface with color harmony, usable features and simplicity in mind.
This was the very first version of the website design. Bigger header with the comparison bar which wasn’t enough easy to see through.
After several iteration, the website design changed a lot and got more flat design character. Also, we started to use the new logo and less color on the site. The only necessary color usage was the case of the store logos. Besides that the menu became easier to read thanks to the bigger font size.
I had to create the interface with color harmony, usable features and simplicity in mind.
BeforeAfter
Grab the slider to compare the on and off state of the options.
Let’s see the different elements I designed one by one in magnification!
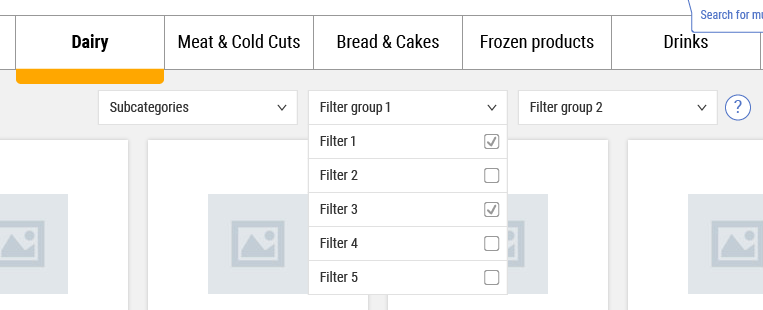
When the customer selected a specific group of groceries then the menu point turned into this well-distinguishable state. The letter turned bold and the orange underline stressed the selected menu point.
Under the menu, you could found further filters. The customers did filter to subcategories of grocery product types and other options such as gluten-free, alcohol-free, lactose-free etc.
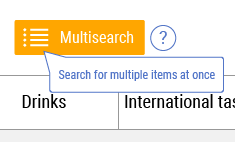
Besides the normal search bar, we implemented a multi-search function as well. This function gave the opportunity to search for multiple different products at once.
The picture also shows the hint about the option when the help option is activated by the Help button. The text bubble always pointed to the actual option that was described here. The hint was activated by clicking or tapping on the help icon.
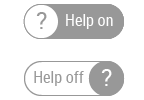
The so called Help button what can activate the help functionality of the website. If was it activated (On status), small blue circles with a question mark appeared.
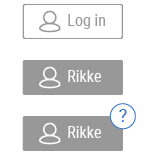
Next to the help function was the Login button. It had three states. If the user wasn’t logged in then it was on the first state (white BG, login text). Otherwise, the button showed the user a simplified nickname (usually first name) that he/she used for the website and the background turned to light grey. The third state contained the help function in the upper right corner.
Just like every shopping site we had our own basket button as well. Here is the three state of the button. If the basket was empty the button appeared with white background without any numbers or special sign.
If the customer started the purchasing process then the button background turned to grey color and over the basket icon a small number in an orange circle showed how many products were in the basket.
When the customer finished the purchase then he/she can click on the button to see all of the products that were collected.
This animation shows the changes on the product card when the product was added to the basket. By clicking on the green basket icon the presentation of the icon changed into a number field where the customers controlled how many items they need. After that, the icon turned back to the original green state.
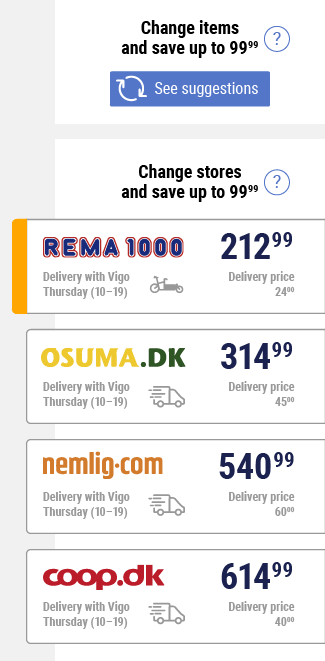
The key function of the whole solution was the possibility of basket and product comparison. This gave the customers the opportunity to buy cheaper as possible. In the designing process was most important to make an interface which is not just easy to use but easy to see through and compare the basket prices at different stores. At the end I successfully simplified the function and I created an easy to use side bar for the function where every information were color coded or icon displayed.
Here is the comparison side bar as a whole.
Let’s see the functionality from up to down.
The most upper part where the customers can change products in their basket. It always showed how much money they can save with the change.
The second part was the basket comparison store by store. The customers can saw every price in every online grocery store and they can choose the best or cheapest option if they wanted to. At first rows, they also can saw how much money they can save if they select the cheapest store/basket.
The cards for the grocery stores also showed every possible details about the delivery.
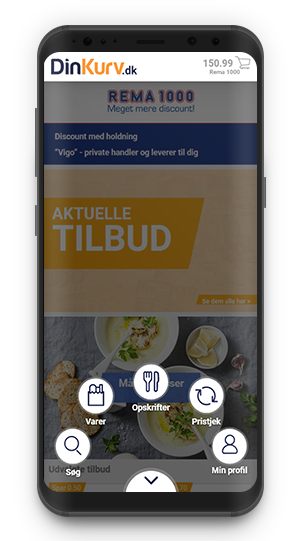
While I and the team worked together on the new design and implementation we also realized the importance of mobile usage. That’s why I started to design a special menu system for those customers who mainly used the DinKurv website’s with their handheld.
You can click on the picture for the details of the development process.
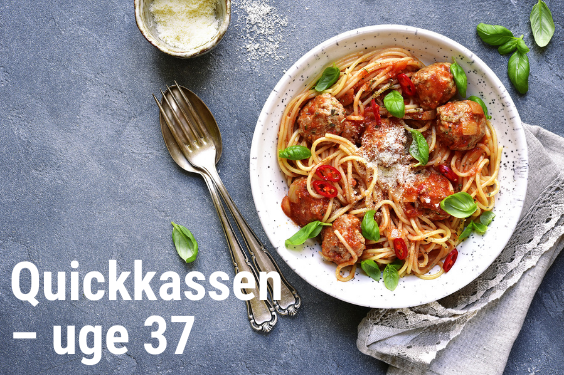
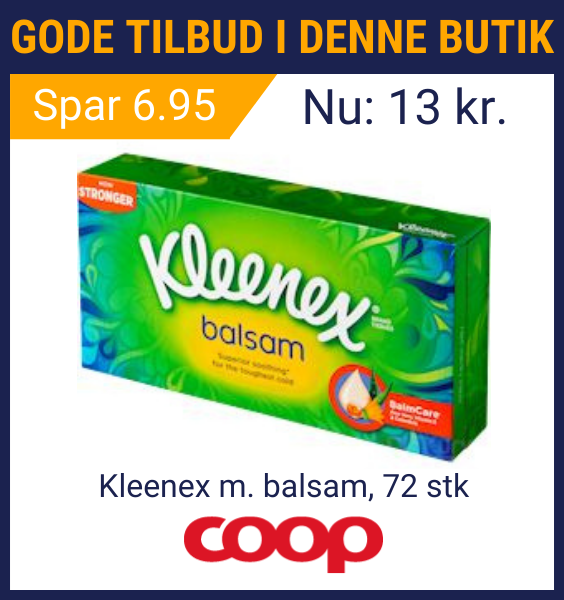
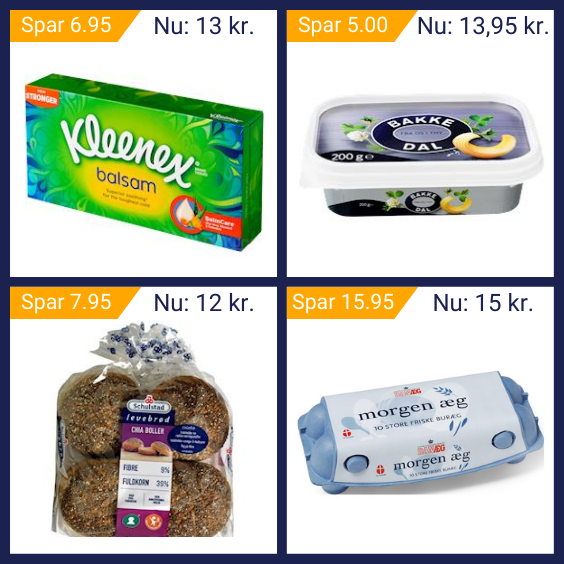
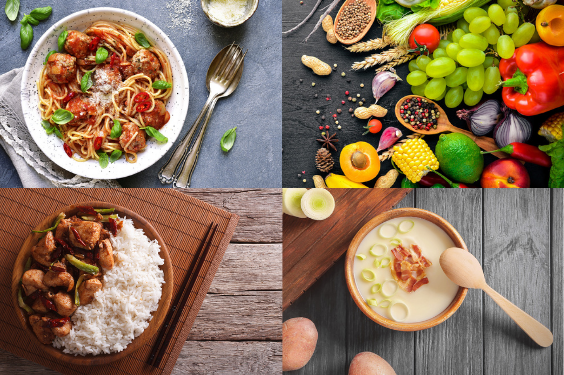
As a graphic designer, I also helped the company develop a basic design library into Canva where they make their content for their Mailchimp powered newsletter and SoMe appearances. Here is a couple of example from their weekly changing content.
In some cases, a brand needs a mascot for a specific task to give a persona such as marketing, PR or just explaining something important about the brand. That is why I created a mascot for DinKurv marketing purposes. This mascot turned out as a little and cute bee. I used the DinKurv color palette and scheme for the creation. We discussed what kind of concepts do we need to associate for the mascot.
In some cases, a brand needs a mascot for a specific task to give a persona such as marketing, PR or just explaining something important about the brand.
Digital drawing phases of the mascot.
The first iteration of the animated mascot. This was also the first test of the lip sync. I created all of the letters for its lip, but I tried to hold with its smile.
After the different user and customer research the company realized we need to elaborate the function of the website and inform the possible future customers about its existence. For this purpose we agreed a creation of a promotional video. I used the earlier designed mascot for make a funny and easy tone of the video and personalize the speaker.
This was the finished version of the promotional video about DinKurv.dk solution.
The bee character talking about the topic and its lip is in sync with the voice. The other animation supporting the storytelling and the content of the video.


